ORIGINAL
Evaluation of tooth angulation and vestibular bone table in anterosuperior teeth prior to immediate implant placement. Descriptive study with cone beams computed tomography
Evaluación de la angulación dentaria y la tabla ósea vestibular en dientes anterosuperiores previo a la colocación inmediata de implantes. Estudio descriptivo con Tomografía computada de haz cónico
Hugo Parco Valiente1, Beatriz Secreto1 *, Maria Isabel Brusca1 *
1Universidad Abierta Interamericana. Buenos Aires, Argentina.
Cite as: Parco Valiente H, Secreto B, Brusca MI. Evaluation of tooth angulation and vestibular bone table in anterosuperior teeth prior to immediate implant placement. Descriptive study with cone beams computed tomography. Odontologia (Montevideo). 2024; 2:132. https://doi.org/10.62486/agodonto2024132
Submitted: 11-02-2024 Revised: 21-05-2024 Accepted: 09-09-2024 Published: 10-09-2024
Editor:
Nairobi
Hernández Bridón ![]()
Corresponding author: Beatriz Secreto *
ABSTRACT
The present study evaluated dental angulation and vestibular bone table thickness in anterosuperior teeth in order to optimize immediate implant placement. Cone beam computed tomography (CBCT) scans of 30 teeth in 15 patients were analyzed, considering the distance between the amelo-cementary boundary and the bone crest, as well as tooth angulation. The results indicated that bone thickness varies at different heights and that the average angulation is greater in men than in women. However, a clear correlation between bone thickness and dental angulation could not be established due to the sample size. The study highlights the importance of these factors in achieving an esthetic and functional result in implant dentistry, suggesting the need for further research to validate these findings and optimize implantation techniques.
Keywords: Oral Surgery; Oral Health; Tooth Angulation; Tomography; Dental Implants.
RESUMEN
El presente estudio evaluó la angulación dental y el grosor de la tabla ósea vestibular en dientes anterosuperiores, con el fin de optimizar la colocación inmediata de implantes. Se analizaron tomografías computarizadas de haz cónico (CBCT) de 30 dientes en 15 pacientes, considerando la distancia entre el límite amelo-cementario y la cresta ósea, así como la angulación dental. Los resultados indicaron que el espesor óseo varía en diferentes alturas y que la angulación promedio es mayor en hombres que en mujeres. Sin embargo, no se pudo establecer una correlación clara entre el grosor óseo y la angulación dental debido al tamaño de la muestra. El estudio resalta la importancia de estos factores para lograr un resultado estético y funcional en la implantología, sugiriendo la necesidad de más investigaciones para validar estos hallazgos y optimizar las técnicas de implantación.
Palabras clave: Cirugía Bucal; Salud Bucal; Angulación Dentaria; Tomografía; Implantes Dentales.
INTRODUCTION
In the last decade, dentistry has experienced a remarkable advance in the use of dental implants, consolidating them as a critical therapeutic option in restorative treatment. Dental implants have demonstrated a high clinical success and survival rate, especially when placed in a healthy, uncomplicated alveolar process.(1,2) However, as implant dentistry has evolved, so has the complexity of the cases in which these devices are used. Today, they are not only implanted in intact alveolar bone but have begun to be used in areas with ridge defects of varying dimensions, in the maxillary sinus, and in the alveoli immediately post-exodontia, among other complex locations.(3)
The growing popularity of these more challenging applications has generated a significant increase in scientific publications addressing various aspects of implant dentistry.(4) However, despite this proliferation of studies, there still needs to be more research that delves into the biology and metabolism of bone healing around dental implants, as well as its implications for peri-implant marginal bone loss.(5,6) This gap in the literature is of particular concern given that osseointegration, an essential process for the long-term success of implants, is intrinsically linked to the quality of the surrounding bone and its ability to regenerate adequately after implant placement.(7,8)
The process of osseointegration is a complex biological phenomenon involving a series of cellular and molecular events at the bone-implant interface. Immediately after implant placement, inflammatory and bone cells initiate a series of reactions that trigger bone regeneration. Several biological factors in the vicinity of the implant regulate this process.(9,10,11) This bone mineralization occurs at both direct and distal implant contact sites and is essential to ensure a high-quality bone-implant contact, thus providing long-term biomechanical stability. However, decreased bone quality in impaired conditions, such as in cases of bone defects or patients with comorbidities affecting osteogenesis, represents a significant risk factor that can compromise implant success.(12,13,14)
In response to these challenges, the current trend in research has been toward developing methods to improve osseointegration and increase implant predictability, particularly in contexts where bone quality is suboptimal.(15,16) This approach has led to several innovations in implant design, surface characterization, and placement methods. Various techniques have been introduced to maximize bone-to-implant contact and thereby improve implants' initial stability and long-term success. In addition, several clinical procedures and surgical protocols have been proposed and evaluated to optimize osseointegration, such as immediate occlusal loading and immediate non-occlusal loading, each with its advantages and limitations, depending on the clinical case.(11)
One of the main challenges in modern implant dentistry is to achieve a balance between initial implant mechanical stability and long-term biological integration. Initial stability, which depends on the quantity and quality of cortical bone available at the implant placement site, is crucial to allow the surrounding bone to regenerate and form a strong bond between the implant and bone tissue. However, factors such as implant angulation, patient gingival biotype, and alveolar bone quality can significantly influence the outcome, both in terms of function and esthetics.(17,18,19)
Research into these aspects has shown that, despite technological and clinical advances, numerous variables can still affect dental implants' success, particularly in complex cases. Understanding these factors and their proper management is critical to ensure that implants integrate correctly into the bone and maintain their long-term stability and functionality, minimizing the risks of complications such as peri-implantitis and marginal bone loss.(20,21)
In this context, the present investigation aims to address some of these challenges by evaluating the efficacy of different implant placement techniques and the impact of bone quality on osseointegration and the long-term success of dental implants. Both biological and biomechanical aspects of implant integration will be analyzed to provide a comprehensive view that will contribute to improving clinical practices in implant dentistry and optimizing patient outcomes.
METHOD
Se realizó un estudio observacional retrospectivo que incluyó exploraciones tomográficas. The patients who attended the Imaging Service of a private clinic of Swiss Medical Group in the Autonomous City of Buenos Aires, Argentina, were 15 patients (n = 30 teeth) who underwent cone beam computed tomography (CBCT) of the anterosuperior teeth. The images corresponded to the right (1,1) and left (2,1) upper central incisors. The patients included in the study signed an informed consent form approved by the institution's ethics committee, allowing the use of their studies for research purposes.
Patients of both sexes, aged between 18 and 70 years, who did not present active periodontal disease and whose CBCT images were of high definition were included in the study. Patients with teeth treated by apicoectomy, periapical pathology, root fractures, root resorption, root resorption, dehiscence, fenestrations in the vestibular bone table, dental restorations, caries lesions, fixed prostheses or dental implants in teeth 1,1 and 2,1 were excluded.
CBCT scans were performed using the CS 3D Imaging v 3.5.18 unit (Carestream Health), following the acquisition parameters recommended by the manufacturer, regardless of the field of view used. The data sets obtained were stored in Digital Imaging and Communications in Medicine (DICOM) format and analyzed with Kodak Dental Imaging Software, version 3.5.18.0.
The CBCT images were reconstructed in transverse slices in the radial plane, perpendicular to the alveolar ridge, with 0,9 mm intervals. To measure the relative inclination of the teeth, the maxilla was oriented horizontally to the plane extending from the anterior nasal spine to the posterior nasal spine. Cross sections in the radial plane of each tooth were observed at the centre of its midfacial position and evaluated relative to the surrounding alveolar bone.
To measure the thickness of the vestibular bone, a reference line was drawn at the centre of the tooth and its long axis and a second perpendicular line was drawn apically. From this second line, three parallel lines were drawn at 3,5 and 7 mm from the Amelo-Cementary Limit (ACL). Bone thickness was measured at these three different locations.
The angle formed by the tooth's longitudinal axis, coincident with the root canal image, and an axis parallel to the palatal bone table was determined.
All CBCT measurements were performed by a single examiner blinded to the clinical findings of the patients. To estimate intraexaminer reliability, CBCT scans of 10 randomly selected patients were evaluated twice, with a 1-week interval between evaluations. Statistical tests were performed to compare numerical values between duplicate measurements, finding mean differences between -0,08 and 0,1 mm without statistical significance (P> 0,1).
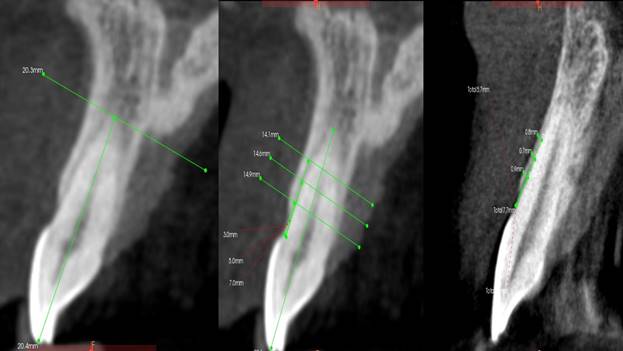
Figure 1. Lines perpendicular to the major axis of the tooth at 3 mm, plus 2 mm = 5 and plus 2 = 7 mm from the LAC
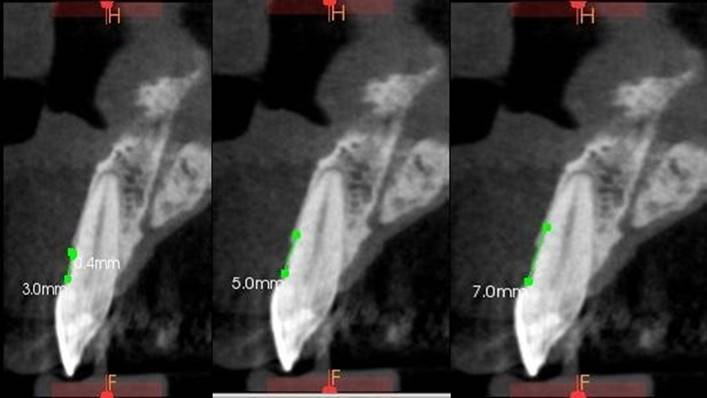
Figure 2. They evaluated in three different positions from the LAC to the alveolar process. Vestibular table thickness measurements
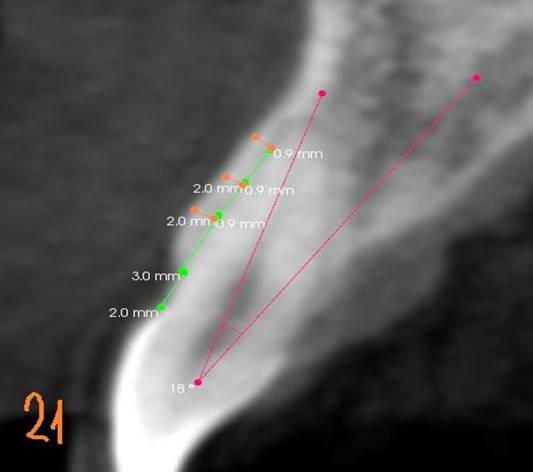
Figure 3. Angle formed by the longitudinal axis of the tooth, which coincides with the image of the root canal in the selected teeth, and the axis parallel to the palatal bone table
RESULTS
The study population consisted of 15 individuals of both sexes, ranging in age from 18 to 74 years. This sample was taken randomly, without choosing limiting conditions beyond those that would have limited clinical care in implant-assisted rehabilitation.
In each of these patients, teeth 1,1 and 2,1 (left and right upper central incisors) were chosen to perform the relevant measurements for this research work, thus obtaining a sample of 30 teeth to be studied.
The distribution of the population according to biological sex was even, with seven male patients accounting for 46,7 % and eight female patients at 53,3 %, respectively.
The most represented age groups were 21 to 30 and 51 to 60. In both cases, the number of female patients prevailed, while in the extreme age groups of the registry, only male patients were found in this sample.
|
Table 1. Distribution of the population sample by sex and age |
||
|
Age Range |
Male |
Female |
|
18-20 |
2 |
- |
|
21-30 |
1 |
3 |
|
31-40 |
1 |
- |
|
41-50 |
2 |
2 |
|
51-60 |
1 |
2 |
|
61-70 |
1 |
- |
|
71-80 |
- |
- |
|
Total |
8 |
7 |
The measurements yielded the following results:
|
Table 2. Measurements according to methodology of the patients participating in the study |
|||||||
|
No. Patients |
|||||||
|
Patient 1 |
|||||||
|
8º |
1,1 |
|
2,1 |
19º |
|||
|
LAC |
3mm |
5mm |
7mm |
LAC |
3mm |
5mm |
7mm |
|
3 |
1,4 |
1 |
1,1 |
3 |
0,9 |
0,8 |
0,8 |
|
Patient 2 |
|||||||
|
23 º |
1,1 |
|
2,1 |
17° |
|||
|
LAC |
3mm |
5mm |
7mm |
LAC |
3mm |
5mm |
7mm |
|
1,5 |
1 |
0,8 |
0,3 |
1,6 |
0,9 |
0,9 |
0,6 |
|
Patient 3 |
|||||||
|
14° |
1,1 |
|
2,1 |
23° |
|||
|
LAC |
3mm |
5mm |
7mm |
LAC |
3mm |
5mm |
7mm |
|
1,5 |
1,1 |
1 |
1,2 |
1,6 |
1 |
0,8 |
0,9 |
|
Patient 4 |
|||||||
|
27 º |
1,1 |
|
2,1 |
29º |
|||
|
LAC |
3mm |
5mm |
7mm |
LAC |
3mm |
5mm |
7mm |
|
2,7 |
1 |
0,8 |
0,8 |
2,3 |
1,2 |
0,2 |
1,2 |
|
Patient 5 |
|||||||
|
13 º |
1,1 |
|
2,1 |
5° |
|||
|
LAC |
3mm |
5mm |
7mm |
LAC |
3mm |
5mm |
7mm |
|
2,9 |
1,2 |
1,7 |
2 |
1,9 |
2 |
1,9 |
2 |
|
Patient 6 |
|||||||
|
16° |
1,1 |
|
2,1 |
19° |
|||
|
LAC |
3mm |
5mm |
7mm |
LAC |
3mm |
5mm |
7mm |
|
2,5 |
0,7 |
0,7 |
0,8 |
2,2 |
0,7 |
0,9 |
0,7 |
|
Patient 7 |
|||||||
|
11 º |
1,1 |
|
2,1 |
24º |
|||
|
LAC |
3mm |
5mm |
7mm |
LAC |
3mm |
5mm |
7mm |
|
3 |
0,2 |
0,3 |
0,3 |
2,8 |
0,4 |
0,4 |
0,4 |
|
Patient 8 |
|||||||
|
5 º |
1,1 |
|
2,1 |
6° |
|||
|
LAC |
3mm |
5mm |
7mm |
LAC |
3mm |
5mm |
7mm |
|
1,7 |
1,1 |
1,7 |
2,3 |
1,5 |
0,9 |
0,9 |
1,2 |
|
Patient 9 |
|||||||
|
3° |
1,1 |
|
2,1 |
9° |
|||
|
LAC |
3mm |
5mm |
7mm |
LAC |
3mm |
5mm |
7mm |
|
2,2 |
0,4 |
0,6 |
0,8 |
1,8 |
0,4 |
0,3 |
0,2 |
|
Patient 10 |
|||||||
|
22 º |
1,1 |
|
2,1 |
6º |
|||
|
LAC |
3mm |
5mm |
7mm |
LAC |
3mm |
5mm |
7mm |
|
2,8 |
0,7 |
0,6 |
0,7 |
2 |
0,9 |
0,7 |
0,7 |
|
Patient 11 |
|||||||
|
13 º |
1,1 |
|
2,1 |
11° |
|||
|
LAC |
3mm |
5mm |
7mm |
LAC |
3mm |
5mm |
7mm |
|
3,2 |
0,7 |
0,7 |
0,6 |
3,6 |
0,9 |
0,6 |
0,7 |
|
Patient 12 |
|||||||
|
7° |
1,1 |
|
2,1 |
18° |
|||
|
LAC |
3mm |
5mm |
7mm |
LAC |
3mm |
5mm |
7mm |
|
1,9 |
0,8 |
0,9 |
1,5 |
2 |
0,9 |
0,9 |
0,9 |
|
Patient 13 |
|||||||
|
11 º |
1,1 |
|
2,1 |
8º |
|||
|
LAC |
3mm |
5mm |
7mm |
LAC |
3mm |
5mm |
7mm |
|
3,2 |
0,5 |
0,5 |
0,5 |
2,8 |
0,5 |
0,4 |
0,7 |
|
Patient 14 |
|||||||
|
7 º |
1,1 |
|
2,1 |
6° |
|||
|
LAC |
3mm |
5mm |
7mm |
LAC |
3mm |
5mm |
7mm |
|
2,2 |
0,5 |
0,7 |
0,6 |
2,6 |
0,6 |
0,6 |
0,6 |
|
Patient 15 |
|||||||
|
25° |
1,1 |
|
2,1 |
18° |
|||
|
LAC |
3mm |
5mm |
7mm |
LAC |
3mm |
5mm |
7mm |
|
1,7 |
0,6 |
0,6 |
0,6 |
1,5 |
0,9 |
0,6 |
0,9 |
Analysis averages and statistics
|
Table 3. Averages and statistics |
||||||||
|
|
1,1 |
2,1 |
||||||
|
|
Average |
D.S. of the sample (s) |
Sample variance (s²) |
n |
Average |
D.S. of the sample (s) |
Sample variance (s²) |
n |
|
LAC |
2,40 |
0,62335497798 |
0,38857142857 |
15 |
2,21 |
0,62777005193 |
0,3940952381 |
15 |
|
3 mm |
0,79 |
0,33266599866 |
0,11066666667 |
0,87 |
0,38631346759 |
0,14923809524 |
||
|
5 mm |
0,84 |
0,39424430424 |
0,15542857143 |
0,73 |
0,39904648255 |
0,15923809524 |
||
|
7 mm |
0,94 |
0,5889457894 |
0,34685714286 |
0,83 |
0,41518785192 |
0,17238095238 |
||
The average LAC in 1,1 was 2,4 mm, while 2,1 was 2,21. When measured at 3 mm, it was 0,79 in 1,1 and 0,87 in 2,1. When measured at 5 mm, it was 0,84 in 1,1 and 0,73 in 2,1. When measured at 7 mm, it was 0,94 in 1,1 and 0,83 in 2,1.
Sample Standard Deviation (s or sampling sigma): s=√(Σ(xi-xˉ)2/(n-1))
Sample Variance (s² or sigma squared sample): s2=Σ(xi−xˉ)2/(n−1)
Analysis of variance results for LAC
The analysis of variance for LAC yielded an F-statistic value of 1,17001 and a P-value of 0,32561. The null hypothesis is rejected since the F-value is greater than the P-value. This indicates that there are significant differences between the groups evaluated.
As for the data, group 1, which includes angles up to 10°, has a mean of 2,1455, with a standard deviation of 0,4741 and a standard error of 0,1429. Group 2, which includes angles from 11° to 19°, has a mean of 2,5167, a standard deviation of 0,7383 and a standard error of 0,2131. Finally, group 3, which includes angles of 20° or more, has a mean of 2,2, with a standard deviation of 0,5888 and a standard error of 0,2225.
The summary ANOVA shows that, among groups with 2 degrees of freedom, the sum of squares was 0,8947, and the mean square was 0,4474, resulting in an F of 1,17 with a P-value of 0,3256. Within groups with 27 degrees of freedom, the sum of squares was 10,3238, with a mean square of 0,3824. Overall, with 29 degrees of freedom, the sum of squares was 11,2185. These results confirm that the F value exceeds the critical P value, so the null hypothesis is rejected.
Analysis of variance results for 3 mm
In the analysis of variance for the 3 mm measurement, the F-value was 0.08864, with a P-value of 0,91544. Since the F-value is less than the critical P-value, the null hypothesis cannot be rejected for this measurement, suggesting no significant difference between the groups.
The data show that group 1 has a mean of 0,8636, with a standard deviation of 0,4905 and a standard error of 0,1479. Group 2 has a mean of 0,8, with a standard deviation of 0,2663 and a standard error of 0,0769. Group 3 has a mean of 0,8429, with a standard deviation of 0,282 and a standard error of 0,1066.
The summary ANOVA indicates that, among groups with 2 degrees of freedom, the sum of squares was 0,0241, with a mean square of 0,012, resulting in an F of 0,0886 and a P-value of 0,9154. Within groups with 27 degrees of freedom, the sum of squares was 3,6631, with a mean square of 0,1357. Overall, with 29 degrees of freedom, the sum of squares was 3,6872.
Analysis of variance results for 5 mm
The analysis of variance for the 5 mm measurement shows an F-statistic value of 1,12157 and a P-value of 0,34048. Since the F-value is greater than the critical P-value, the null hypothesis is rejected, indicating the presence of significant differences between the groups.
The data reveal that group 1 has a mean of 0,8818, with a standard deviation of 0.5016 and a standard error of 0,1512. Group 2 has a mean of 0,8, with a standard deviation of 0,3464 and a standard error of 0,1. Group 3 has a mean of 0,6, with a standard deviation of 0,2309 and a standard error of 0,0873.
The summary ANOVA shows that, among groups with 2 degrees of freedom, the sum of squares was 0,3453, with a mean square of 0,1726, resulting in an F of 1,1216 and a P-value of 0,3405. Within groups with 27 degrees of freedom, the sum of squares was 4,1558, with a mean square of 0,1539. Overall, with 29 degrees of freedom, the sum of squares was 4,5011.
Analysis of variance results for 7 mm
The analysis of variance for the 7 mm measurement yields an F-statistic value of 1,24828 and a P-value of 0,30304. Since the F-value is greater than the P-value, the null hypothesis is rejected, suggesting the existence of significant differences between the groups.
The data show that group 1 has a mean of 1,0636, with a standard deviation of 0,6423 and a standard error of 0,1937. Group 2 has a mean of 0,8333, with a standard deviation of 0,4313 and a standard error of 0,1245. Group 3 has a mean of 0,7, with a standard deviation of 0,3055 and a standard error of 0,1155.
The summary ANOVA indicates that, among groups with 2 degrees of freedom, the sum of squares was 0,6224, with a mean square of 0,3112, resulting in an F of 1,2483 and a P-value of 0,303. Within groups with 27 degrees of freedom, the sum of squares was 6,7317, with a mean square of 0,2493. Overall, with 29 degrees of freedom, the sum of squares was 7,3541
Graphical and comparative analysis of results
The results can be illustrated in the following figure by disaggregating and arranging the measurements in increasing order according to the angulation of the central axis of the tooth and grouping them according to the measurement height. This figure compares the results obtained at different measuring heights, organized according to angulation.
Figure 4. Disaggregation of the measurements sorted in increasing order of angulation
· The measurements corresponding to the bone thickness in the segment that goes from the Amelo-Cementary Limit (ACL) to the bone crest are shown in green.
· The measurements taken 3 mm below the previous measurement are in blue.
· In orange, the measurements at 5 mm below the first measurement, that is, 2 mm below the previous measurement, are shown.
· In violet colour, the measurements at 7 mm from the first measurement, also 2 mm below the previous measurement, are shown.
The following was observed when comparing these values and analyzing the variability from the statistical point of view using a regression model:
· LAC of the sample: the maximum range was 3,6 mm and the minimum 1,5 mm, with a coefficient of determination R² = 0,003.
· Vestibular table thickness at 3 mm: the range varied between a maximum of 2 mm and a minimum of 0,2 mm, with an R² = 0,004.
· Vestibular table thickness at 5 mm: the maximum range was 1,9 mm, and the minimum was 0,2 mm, with an R² = 0,004.
· Vestibular table thickness at 7 mm: the range ranged from a maximum of 2,3 mm to a minimum of 0,2 mm, with an R² = 0,137.
The graphs' bars were distributed according to the different degrees of angulation, organized in an ascending range starting at 3° and reaching up to 29° in the population sample analyzed according to cone beam tomography.
DISCUSSION
The angulation of the upper incisors and the vestibular bone table are essential considerations when placing immediate implants in this area. These factors help determine the esthetics and functionality of the final result.
· Tooth angulation: when placing an implant, the angulation of the implant must match the natural inclination of the extracted teeth for esthetic appearance and proper function. This involves ensuring that the implant is correctly positioned with the adjacent teeth so that the artificial teeth look natural and follow the laws of occlusion.
· Vestibular table: the vestibular table refers to the anterior surface of the incisors. It is essential to place the implant so that the artificial tooth is inserted into the bone within this table to achieve an esthetic appearance and harmony with the gum and lip profile.
Patients may experience various problems after tooth extractions. Due to trauma and periodontal ligament loss, post-extraction alveolar ridge resorption cannot be prevented. Atraumatic extraction, alveolar preservation, grafting and implant placement immediately after extraction are some procedures performed to minimize or prevent alveolar bone resorption. Osseointegration is essential to maintain the clinical efficacy of dental implants. If the supporting tissues at the implant site are resorbed and worsened by risk factors for recession, there may be considerable esthetic and functional failure. Three-dimensional implant placement preserves the buccal bone, resulting in an excellent emergence profile. Resorption at the posterior alveolar ridge may decrease adherent keratinized tissue and vestibular depth. This could hurt implant stability and lead to peri-implantitis, resulting in implant failure. Partial extraction therapy has yielded effective esthetic results without papilla loss or arch collapse. It is important to remember that the planning of implant placement, more so if they are immediate and in anterosuperior teeth, is a delicate process that should be performed by a dental professional, preferably a periodontist or a dentomaxillofacial surgeon with experience in implant dentistry. Advanced imaging techniques, such as computed tomography, are used to accurately plan the location and angulation of the implant accurately, thus ensuring an optimal esthetic and functional result.
Over the years, patients' expectations of implant treatment have changed, and esthetics plays a vital role in defining what is now called rehabilitation success. Of the many factors that influence the outcome of rehabilitation, the two main ones are bone and soft tissue deficiencies at the intended implant site. Many surgical approaches are described in terms of timing of implant placement and management of regenerative procedures. According to Testori et al.,(22) there are different implant placement alternatives in the esthetic area, in particular: (i) timing of implant placement, regenerative procedures, altered passive eruption; (ii) correct three-dimensional implant position between canines and in the premolar area; (iii) multiple missing teeth in the esthetic area with options of single tooth/pontic or prosthetic compensation; (iv) implant placement in infected sites; and (v) the influence of abutment and crown morphology on implant position.
The present work considers the adequate diagnosis with the tomographic measurements evaluated as fundamental. The authors conclude that immediate implant placement can be a successful procedure regarding esthetics, but it depends on the technique and requires an experienced team. Immediate placement is less traumatic for the patient as it involves fewer surgical procedures. Patients tend to prefer this clinical approach concerning quality of life and agree with this study that the diagnostic phase is of utmost importance, as not only are bone and soft tissue deficiencies addressed, but also the surrounding soft tissues, altered passive eruption and root morphology adjacent to the edentulous area. The long axis of the implant, pointing to the incisal edge of future restorations, is the most appropriate implant position when using a shoulderless abutment and allows for a restorative crown morphology with a cervical contour that resembles a natural tooth. A shoulderless abutment provides more room for tissue growth than the traditional shoulder finish line abutment.
In 1978, the immediate implant placement protocol was introduced into clinical practice as an alternative to the standard surgical protocol, for which there is a 3- to 4-month waiting period. Immediate restoration has been defined as any restoration placed within 48 hours of the implant. Insertion, without contact with the opposing dentition in both centric and eccentric occlusions.(23) The concept of immediate implant placement and provisionalization (IIPP) was introduced by Wöhrle in 1998,(24) and has since proven to be a predictable treatment modality in ideal esthetic situations, with success rates comparable to those of delayed implant placement with delayed prosthetic loading.(22) Unfortunately, it is necessary to clarify that the IIPP protocol, despite numerous advantages, such as fewer patient office visits, shorter treatments, and fewer surgical interventions,(25) does not preclude dimensional changes after tooth extractions, both in bone and soft tissues. These unavoidable physiologic events may negatively influence the esthetic and functional outcomes of the entire treatment due to vestibular bone loss, gingival recession, or dimensional change of the alveolar bone crest.(26)
Although the sample presented in this section of this study is small, it agrees with Gomes dos Santos et al.(27) who, in their study, 'Analysis of buccal bone wall, root and alveolar inclination. Bone dimensions in the mandible. A descriptive study using cone beam computed tomography' observed that the alveolar bone thickness was less than 0.6 mm in 50 % of the teeth at the most coronal location of the maxillary teeth. At mid-root, the bone thickness was, on average, 0,96 (SD 0,6) mm. For the same maxilla, the vertical distance between the vestibular alveolar ridge and the amelocemental junction and the measured angulation were, on average, 3,6 (SD 1,2) mm and 12,1° (SD 1,4°), respectively. Their study revealed that the buccal alveolar bone thickness was usually less than 1 mm. Consequently, in such cases, immediate placement of dental implants is not recommended or should be combined with bone regeneration techniques.
CONCLUSIONS
The placement of immediate implants in the anterosuperior region should consider the vestibular bone table and the angulation of the teeth, as these factors are crucial to achieving an esthetic and functional result. The three-dimensional placement of implants is essential to prevent mucogingival problems and ensure the esthetic integration of prosthetic crowns.
The study analyzed 30 CT scans (15 of each upper central incisor) of 15 patients (8 females and seven males). The distance between the amino-commentary boundary and the bone crest (LAC) ranged from 2,15 to 2,52 mm, aligning with the values reported by Januário (1,6 to 3 mm). Vestibular bone table thicknesses at different heights were 0,80-0,86 mm at 3 mm, 0,60-0,88 mm at 5 mm, and 0,70-1,06 mm at 7 mm, showing more significant variations in the latter.
As for dental angulation, the males presented an average of 16,86º, with 15º in tooth 1,1 and 18º in tooth 2,1. Women showed a lower average of 11,69º, with 12,5º in tooth 1,1 and 10,87º in tooth 2,1. Only 23,33 % of the patients presented angulation more excellent than 20º, with two cases that could present complications (angles of 27º and 29º).
The study could not establish a clear correlation between the thickness of the vestibular table and dental angulation due to the sample size. However, it was observed that only 6,66 % of the patients could have difficulties related to angulation. The measurements agreed with previous studies, although the correlation reported by Kan19 suggesting that 81,1 % of class 1 cases allow implant placement without considering angulation was not confirmed, suggesting the need for future research.
REFERENCES
1. Lang NP, Lang NP, Berglundh T, Giannobile WV, Sanz M. Lindhe’s clinical periodontology and implant dentistry. vol. 2. 7.a ed. New Jersey, USA: Wiley-Blackwell; 2021.
2. Newman MG, Dragan IF, Elangovan S, Karan AK. Periodontología Clínica Esencial. 1.a ed. Madrid, España: Elsevier; 2023.
3. Alghamdi HS, Jansen JA. The development and future of dental implants. Dent Mater J 2020;39:167-72. https://doi.org/10.4012/dmj.2019-140.
4. Januário AL, Duarte WR, Barriviera M, Mesti JC, Araújo MG, Lindhe J. Dimension of the facial bone wall in the anterior maxilla: a cone-beam computed tomography study. Clin Oral Implants Res 2011;22:1168-71. https://doi.org/10.1111/j.1600-0501.2010.02086.x.
5. Kan J. Immediate placement and provisionalization of maxillary anterior single implant with guided tissue graft, and coronally positioned flap procedures. Int J Esthet Dent 2016;11:174-85.
6. Chappuis V, Araújo MG, Buser D. Clinical relevance of dimensional bone and soft tissue alterations post‐extraction in esthetic sites. Periodontology 2000;73:73-83.
7. Ahamed MS, Mundada BP, Paul P, Reche A. Partial Extraction Therapy for Implant Placement: A Newer Approach in Implantology Practice. Cureus 2022;14:e31414. https://doi.org/10.7759/cureus.31414.
8. Buser D, Sennerby L, De Bruyn H. Modern implant dentistry based on osseointegration: 50 years of progress, current trends and open questions. Periodontol 2000 2017;73:7-21. https://doi.org/10.1111/prd.12185.
9. Kim JH, Lee JG, Han DH, Kim HJ. Morphometric analysis of the anterior region of the maxillary bone for immediate implant placement using micro‐CT. Clin Anat 2011;24:462-8.
10. Östman P, Hupalo M, Del Castillo R, Emery RW, Cocchetto R, Vincenzi G, et al. Immediate Provisionalization of NanoTite Implants in Support of Single‐Tooth and Unilateral Restorations: One‐Year Interim Report of a Prospective, Multicenter Study. Clin Implant Dent Relat Res 2010;12. https://doi.org/10.1111/j.1708-8208.2009.00166.x.
11. Lazzara RJ, Testori T, Meltzer A, Misch C, Porter S, Castillo R, et al. Immediate Occlusal Loading (IOL) of dental implants: Predictable results through DIEM guidelines. Pract Proced Aesthetic Dent PPAD 2004;16:3-15.
12. Grunder U, Gracis S, Capelli M. Influence of the 3-D bone-to-implant relationship on esthetics. Int J Periodontics Restor Dent 2005;25:113-9.
13. Attard NJ, Zarb GA. Immediate and early implant loading protocols: a literature review of clinical studies. J Prosthet Dent 2005;94:242-58.
14. Botticelli D, Berglundh T, Lindhe J. Hard-tissue alterations following immediate implant placement in extraction sites. J Clin Periodontol 2004;31:820-8. https://doi.org/10.1111/j.1600-051X.2004.00565.x.
15. Buser D, Martin W, Belser UC. Optimizing esthetics for implant restorations in the anterior maxilla: anatomic and surgical considerations. Int J Oral Maxillofac Implants 2004;19 Suppl:43-61.
16. Uppal R, Sheokand V, Bhardwaj A, Varghese CM, Sehrawat H. Aesthetic Considerations in Implant Therapy - A Review. J Evol Med Dent Sci 2022;11:277-82. https://doi.org/10.14260/jemds/2022/52.
17. Hui E, Chow J, Li D, Liu J, Wat P, Law H. Immediate provisional for single-tooth implant replacement with Brånemark system: preliminary report. Clin Implant Dent Relat Res 2001;3:79-86. https://doi.org/10.1111/j.1708-8208.2001.tb00235.x.
18. Kan JYK, Rungcharassaeng K, Lozada J. Immediate placement and provisionalization of maxillary anterior single implants: 1-year prospective study. Int J Oral Maxillofac Implants 2003;18:31-9.
19. Kan JYK, Roe P, Rungcharassaeng K, Patel RD, Waki T, Lozada JL. Classification of sagittal root position in relation to the anterior maxillary osseous housing for immediate implant placement: a cone beam computed tomography study. Int J Oral Maxillofac Implants 2011;26:873-6.
20. Drago C. Procedimientos de laboratorio en implantes paso a paso. 1.a ed. Medellín, Colombia: Amolca; 2012.
21. Drago CJ, Lazzara RJ. Immediate provisional restoration of Osseotite implants: a clinical report of 18-month results. Int J Oral Maxillofac Implants 2004;19:534-41.
22. Testori T, Weinstein T, Scutellà F, Wang H-L, Zucchelli G. Implant placement in the esthetic area: criteria for positioning single and multiple implants. Periodontol 2000 2018;77:176-96. https://doi.org/10.1111/prd.12211.
23. De Angelis P, Manicone PF, Rella E, Liguori MG, De Angelis S, Tancredi S, et al. The effect of soft tissue augmentation on the clinical and radiographical outcomes following immediate implant placement and provisionalization: a systematic review and meta-analysis. Int J Implant Dent 2021;7:86. https://doi.org/10.1186/s40729-021-00365-4.
24. Wöhrle PS. Single-tooth replacement in the aesthetic zone with immediate provisionalization: fourteen consecutive case reports. Pr Periodontics Aesthet Dent 1998;10:1116.
25. Esposito M, Grusovin MG, Polyzos IP, Felice P, Worthington HV. Timing of implant placement after tooth extraction: immediate, immediate-delayed or delayed implants? A Cochrane systematic review. Eur J Oral Implant 2010;3:189-205.
26. Cosyn J, Hooghe N, Bruyn H. A systematic review on the frequency of advanced recession following single immediate implant treatment. J Clin Periodontol 2012;39:582-9.
27. Dos Santos JG, Oliveira Reis Durão AP, De Campos Felino AC, De Faria De Almeida RMCL. Analysis of the Buccal Bone Plate, Root Inclination and Alveolar Bone Dimensions in the Jawbone. A Descriptive Study Using Cone-Beam Computed Tomography. J Oral Maxillofac Res 2019;10. https://doi.org/10.5037/jomr.2019.10204.
FINANCING
The authors did not receive funding for the development of this research.
CONFLICT OF INTEREST
The authors declare that there is no conflict of interest.
AUTHORSHIP CONTRIBUTION
Conceptualization: Hugo Parco Valiente, Beatriz Secreto, María Isabel Brusca.
Data curation: Hugo Parco Valiente, Beatriz Secreto, María Isabel Brusca.
Formal analysis: Hugo Parco Valiente, Beatriz Secreto, María Isabel Brusca.
Research: Hugo Parco Valiente, Beatriz Secreto, María Isabel Brusca.
Methodology: Hugo Parco Valiente, Beatriz Secreto, María Isabel Brusca.
Project Management: Hugo Parco Valiente, Beatriz Secreto, María Isabel Brusca.
Resources: Hugo Parco Valiente, Beatriz Secreto, María Isabel Brusca.
Software: Hugo Parco Valiente, Beatriz Secreto, María Isabel Brusca.
Supervision: Hugo Parco Valiente, Beatriz Secreto, María Isabel Brusca.
Validation: Hugo Parco Valiente, Beatriz Secreto, María Isabel Brusca.
Visualization: Hugo Parco Valiente, Beatriz Secreto, María Isabel Brusca.
Writing - original draft: Hugo Parco Valiente, Beatriz Secreto, María Isabel Brusca.
Writing - revision and editing: Hugo Parco Valiente, Beatriz Secreto, María Isabel Brusca.